Project 1
Common Issues
Blog Posts
Blog posts should be in paragraphs, not one big wall of text.
Please double check your rendered assignment before submitting.
In markdown hit enter to make a new paragraph.
Default Colors
Pretty please do not use default colors. I will take off points for default colors going forward. (grey is okay)
Year of data
Adding the year the data is from. This data is reproduced every year. If you do not provide a year the data is from it is annoying to reproduce your research.

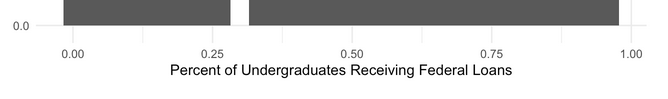
Confusing labels
Make the labels and scale match. Don’t say ‘percent’ then show ratios or proportions.
Comments
Comments on code are missing. You should have a brief comment for each block of code describing what important findings you have in your code. You can also describe what you are doing if your code is unclear.