library(tidyverse)Frequency Plots
Libraries
Recall Variable Types
Categorical Variables in R are called:
Character variables
Factors
Numeric Variables in R are called:
Integer
Double
Create Histograms
To see the spread, center and shape of a numeric variable.
starwars |>
  ggplot(aes(x= height )) +
  geom_histogram()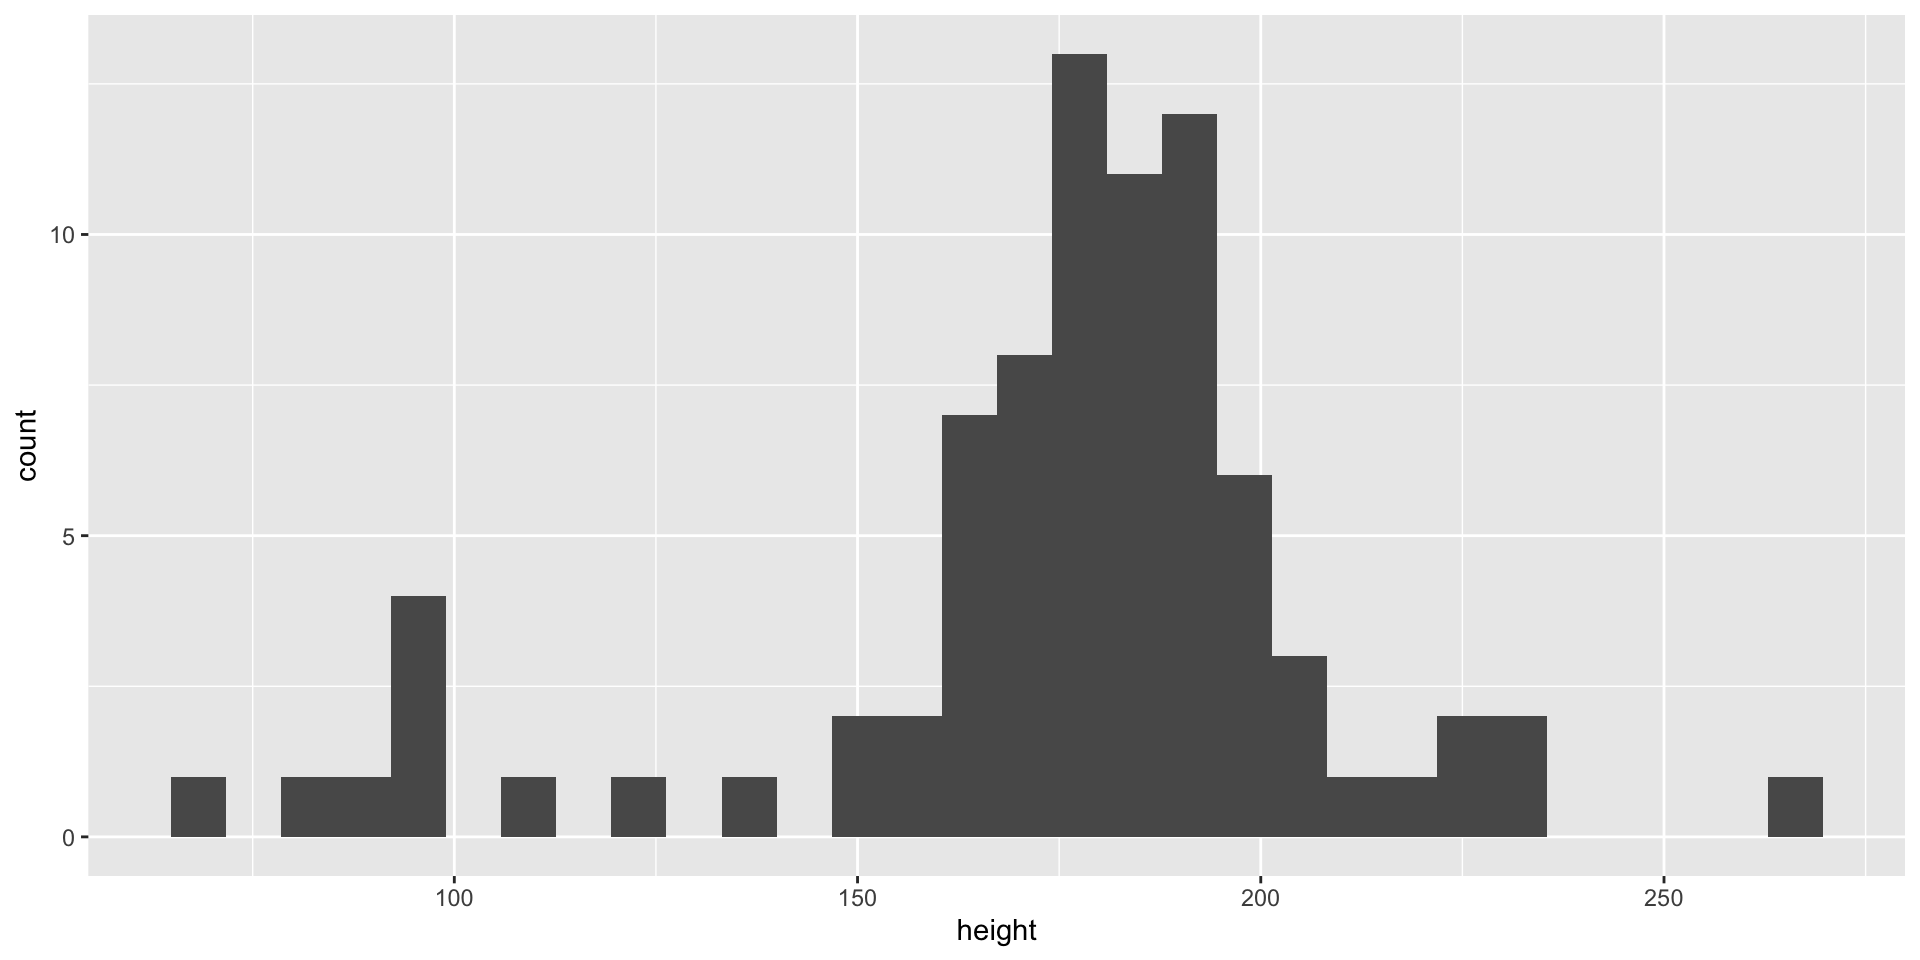
Histograms
- Make bins for the numbers
- Counts the occurrence of a value within bins
- The height is the number of counts.
We can adjust the bin or bin size.
Create Bar graph
Visualize the counts of a categorical variable
starwars |>
  ggplot(aes(x = hair_color))+
  geom_bar()
Two bar graphs
Use geom_bar() is data is not precounted
Use geom_col() if data is precounted.
starwars |>
  count(hair_color, name = "no_of_characters") |>
  ggplot(aes(x= hair_color, y= no_of_characters)) +
  geom_col()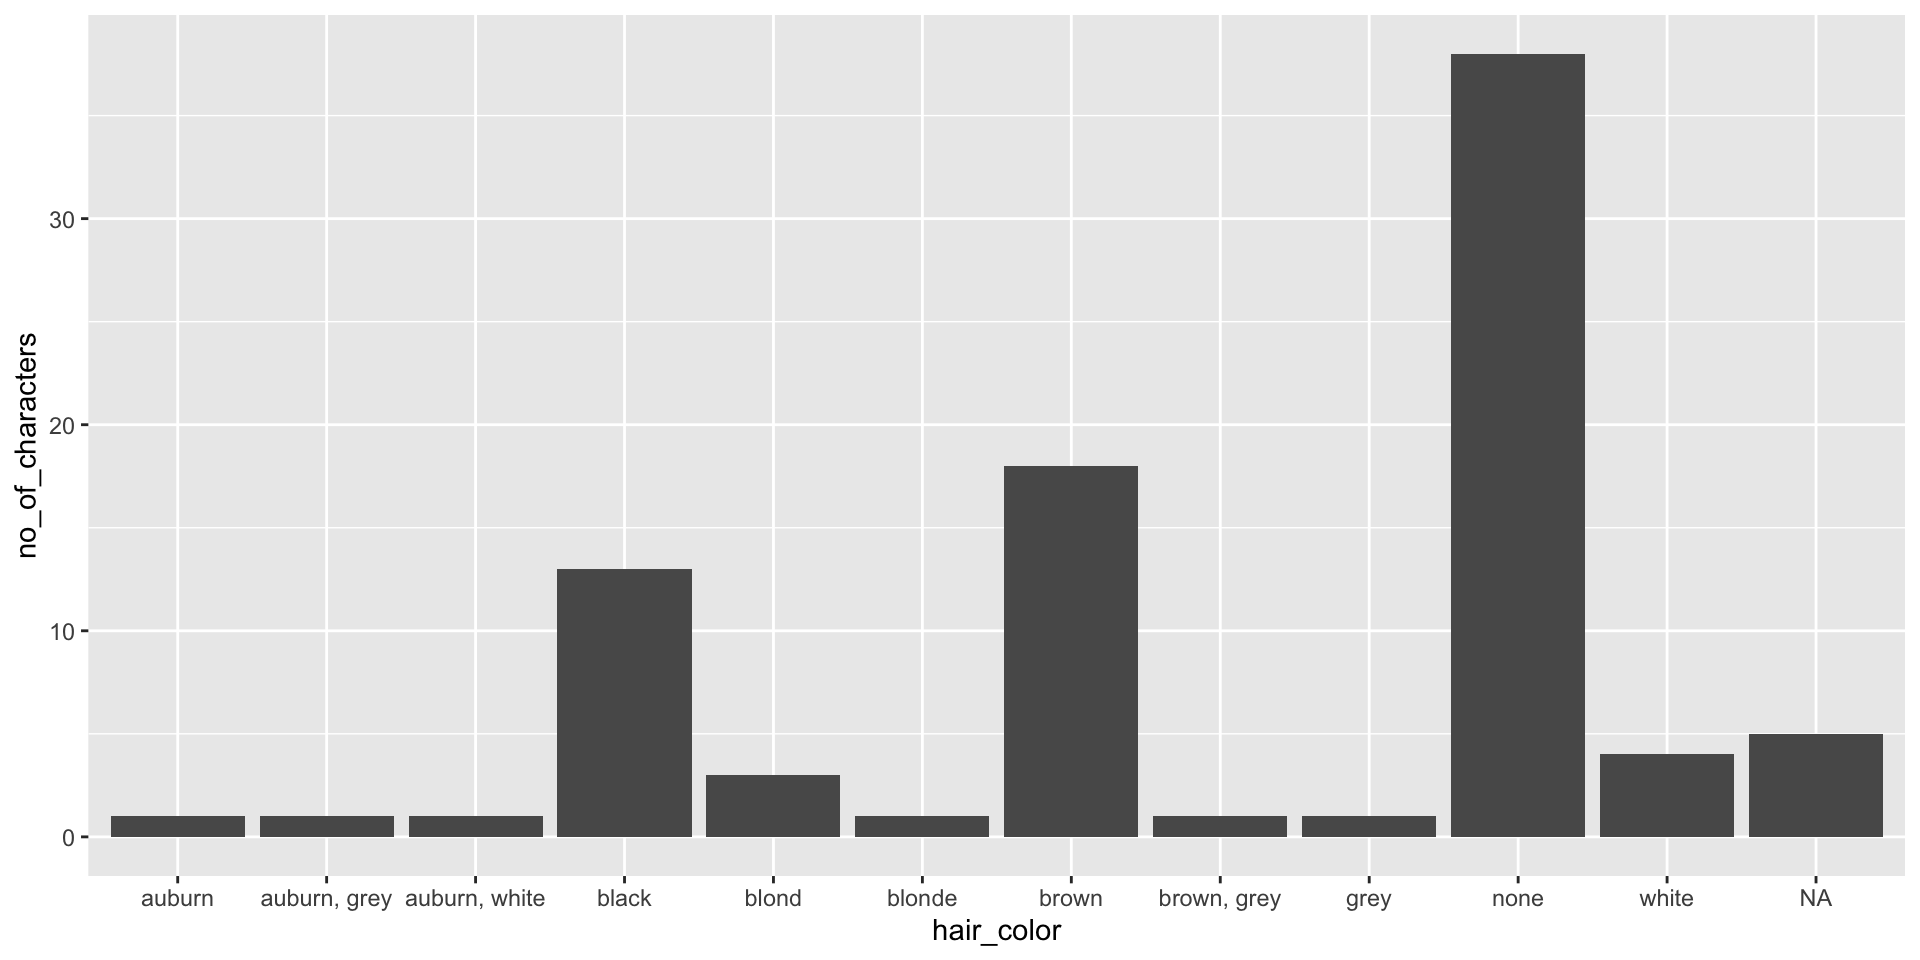
Create Facets
We can split graphs by another categorical or discrete variable.
starwars |>
  ggplot(aes(x = hair_color))+
  geom_bar() +
  facet_wrap(~gender)+
  theme(axis.text.x = element_text(angle = 90)) # rotating text so its easier to read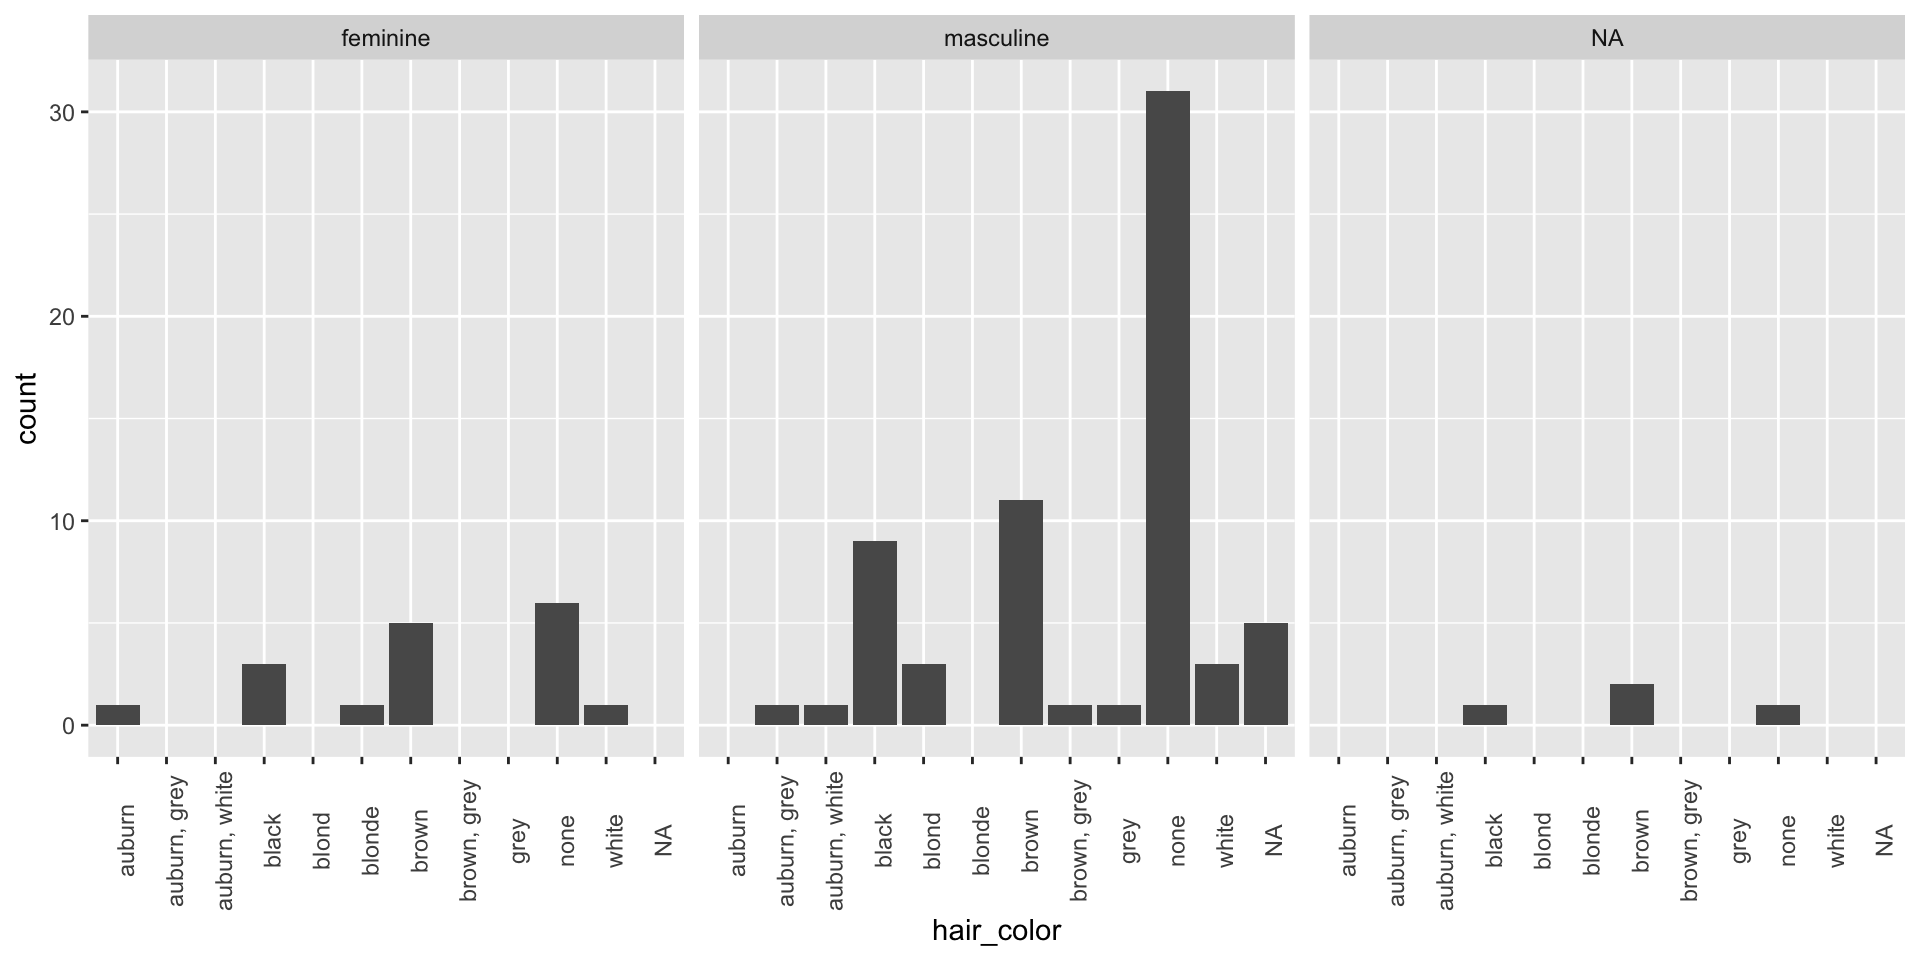
Too many facets
Be careful too many facets can obscure the visualization.
starwars |>
  ggplot(aes(x = hair_color))+
  geom_bar() +
  facet_wrap(~species) +
  theme(axis.text.x = element_text(angle = 90))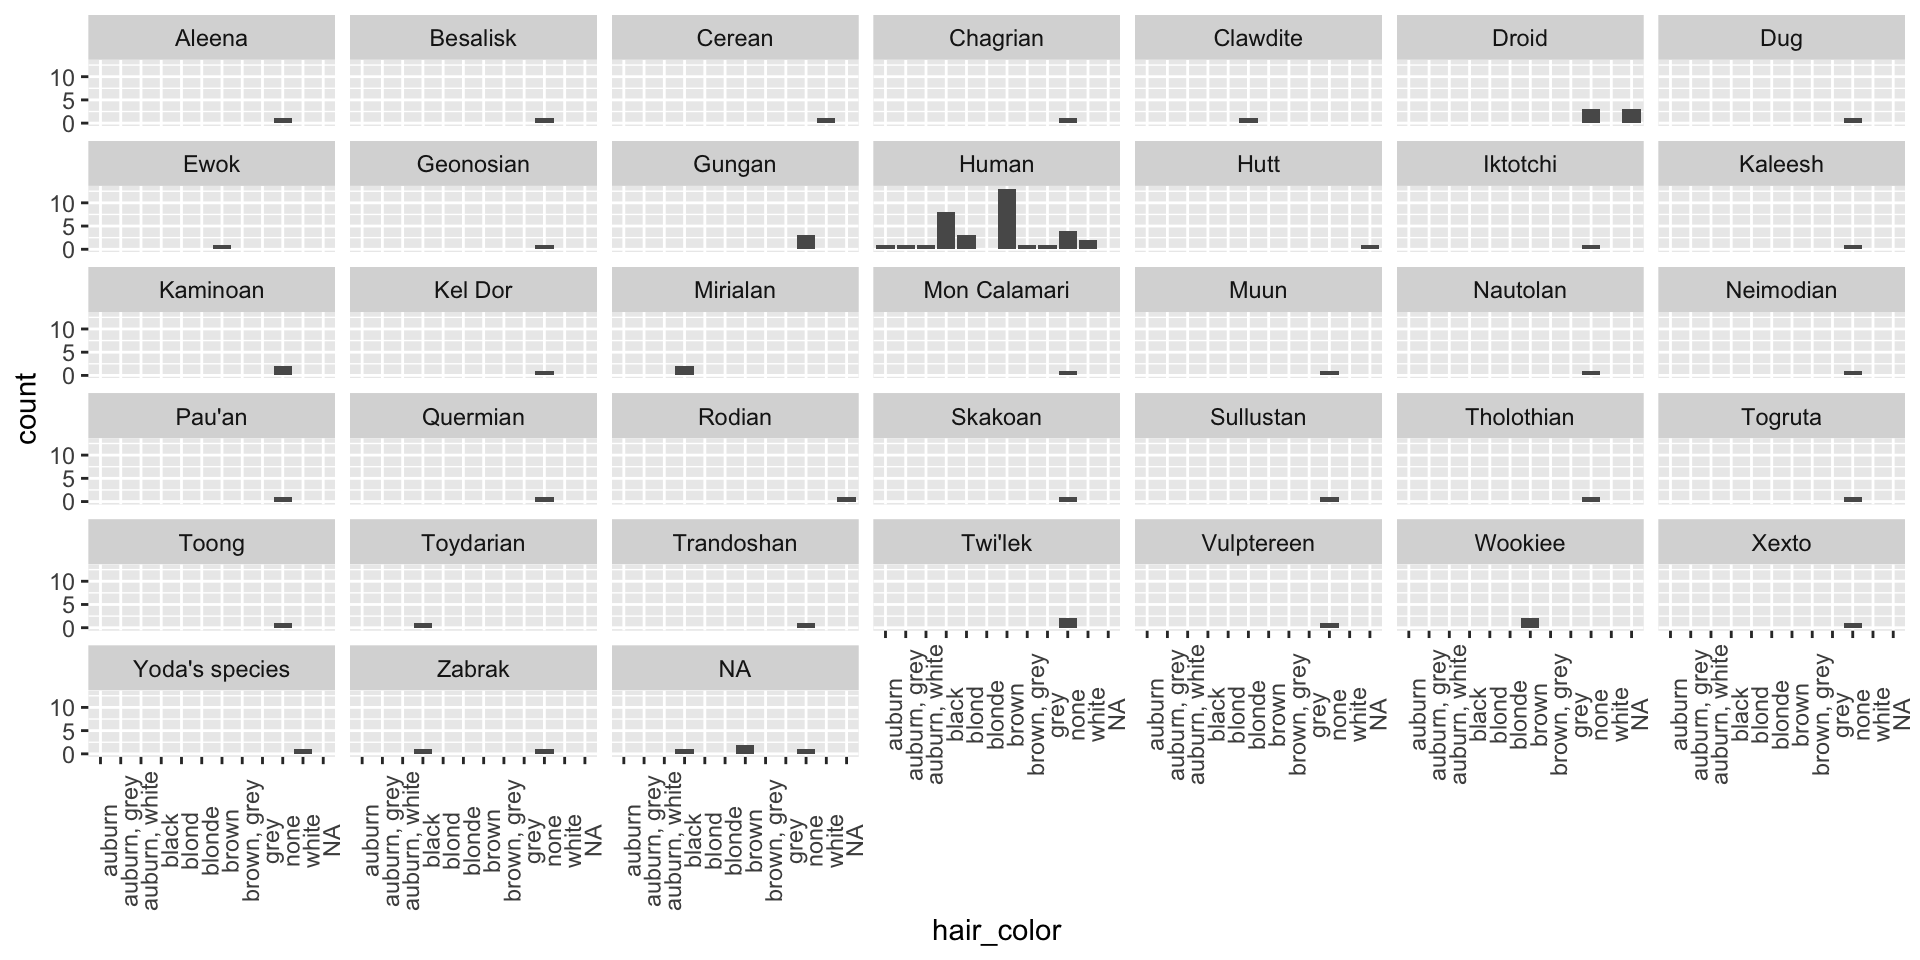
Try one
Facet starwar’s characters’ height by their gender.