library(tidyverse)
library(sf)
library(tidygeocoder)
library(maps)Static Maps w/ ggplot
Libraries
tidygeocoder
Let’s find the latitude and longitude for a couple of places.
addresses<- tibble(address=c("Smith College", "2 Tyler Ct, Northampton, MA 01060", "Holyoke Community College")) |>
geocode(address, method="osm") |>
  mutate(name = c("Smith College","McConnell Hall","Holyoke Community College"))

addresses
# A tibble: 3 × 4
address lat long name
<chr> <dbl> <dbl> <chr>
1 Smith College 42.3 -72.6 Smith College
2 2 Tyler Ct, Northampton, MA 01060 42.3 -72.6 McConnell Hall
3 Holyoke Community College 42.2 -72.7 Holyoke Community CollegeMy first map
Let’s plot those with ggplot.
ggplot(addresses) +
geom_point(aes(long,lat)) 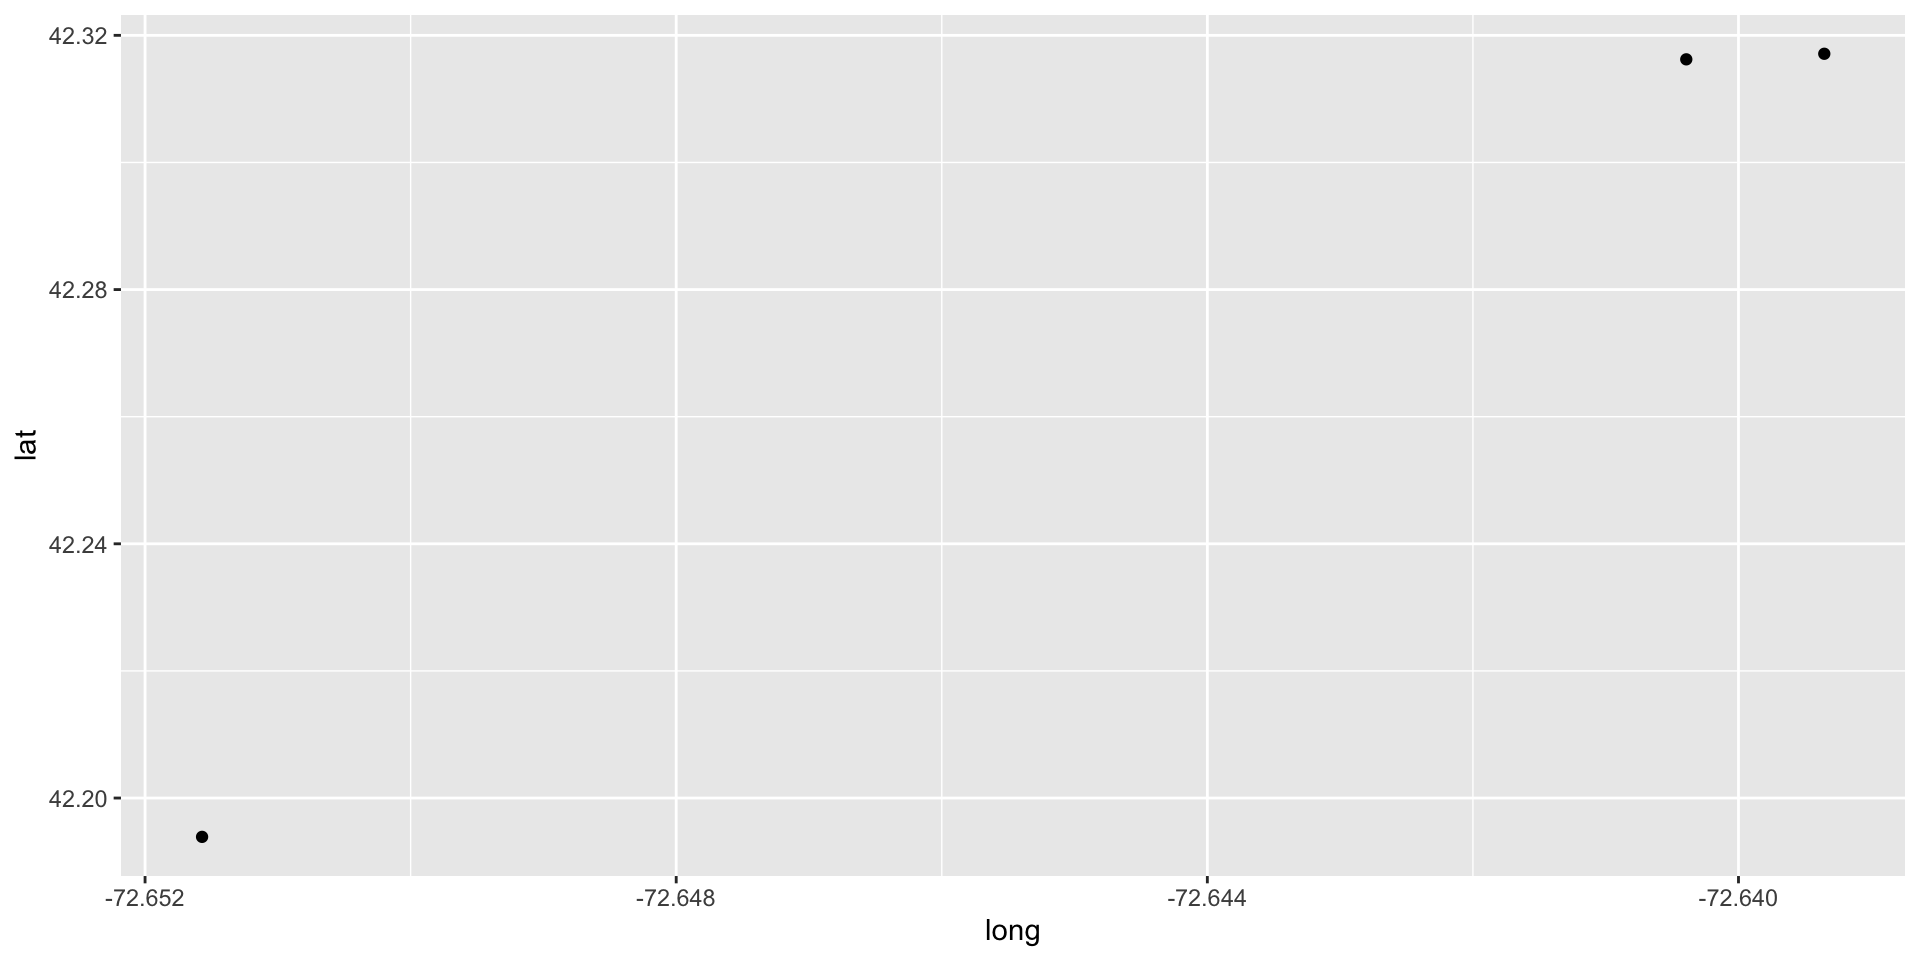
Not very exciting. We’ll add it it in a moment.
Mass Map data
Let’s build a map of Massachusetts with the map_data() function
# map_data comes from ggplot2

ma_counties <- map_data("county", "massachusetts") |>
  select( long, lat, group, id = subregion)

head(ma_counties)
long lat group id
1 -70.67435 41.73997 1 barnstable
2 -70.53683 41.79727 1 barnstable
3 -70.53683 41.79727 1 barnstable
4 -70.51392 41.78008 1 barnstable
5 -70.47954 41.75716 1 barnstable
6 -70.41078 41.73425 1 barnstableMass Map
Notice there are a lot of points for barnstable. Those are the vertices of a polygon. Let’s draw the polygon with the points.
ma_counties |> ggplot(aes(long,lat,group=group))+
  geom_polygon(fill = "white", colour = "grey50")+
geom_point() 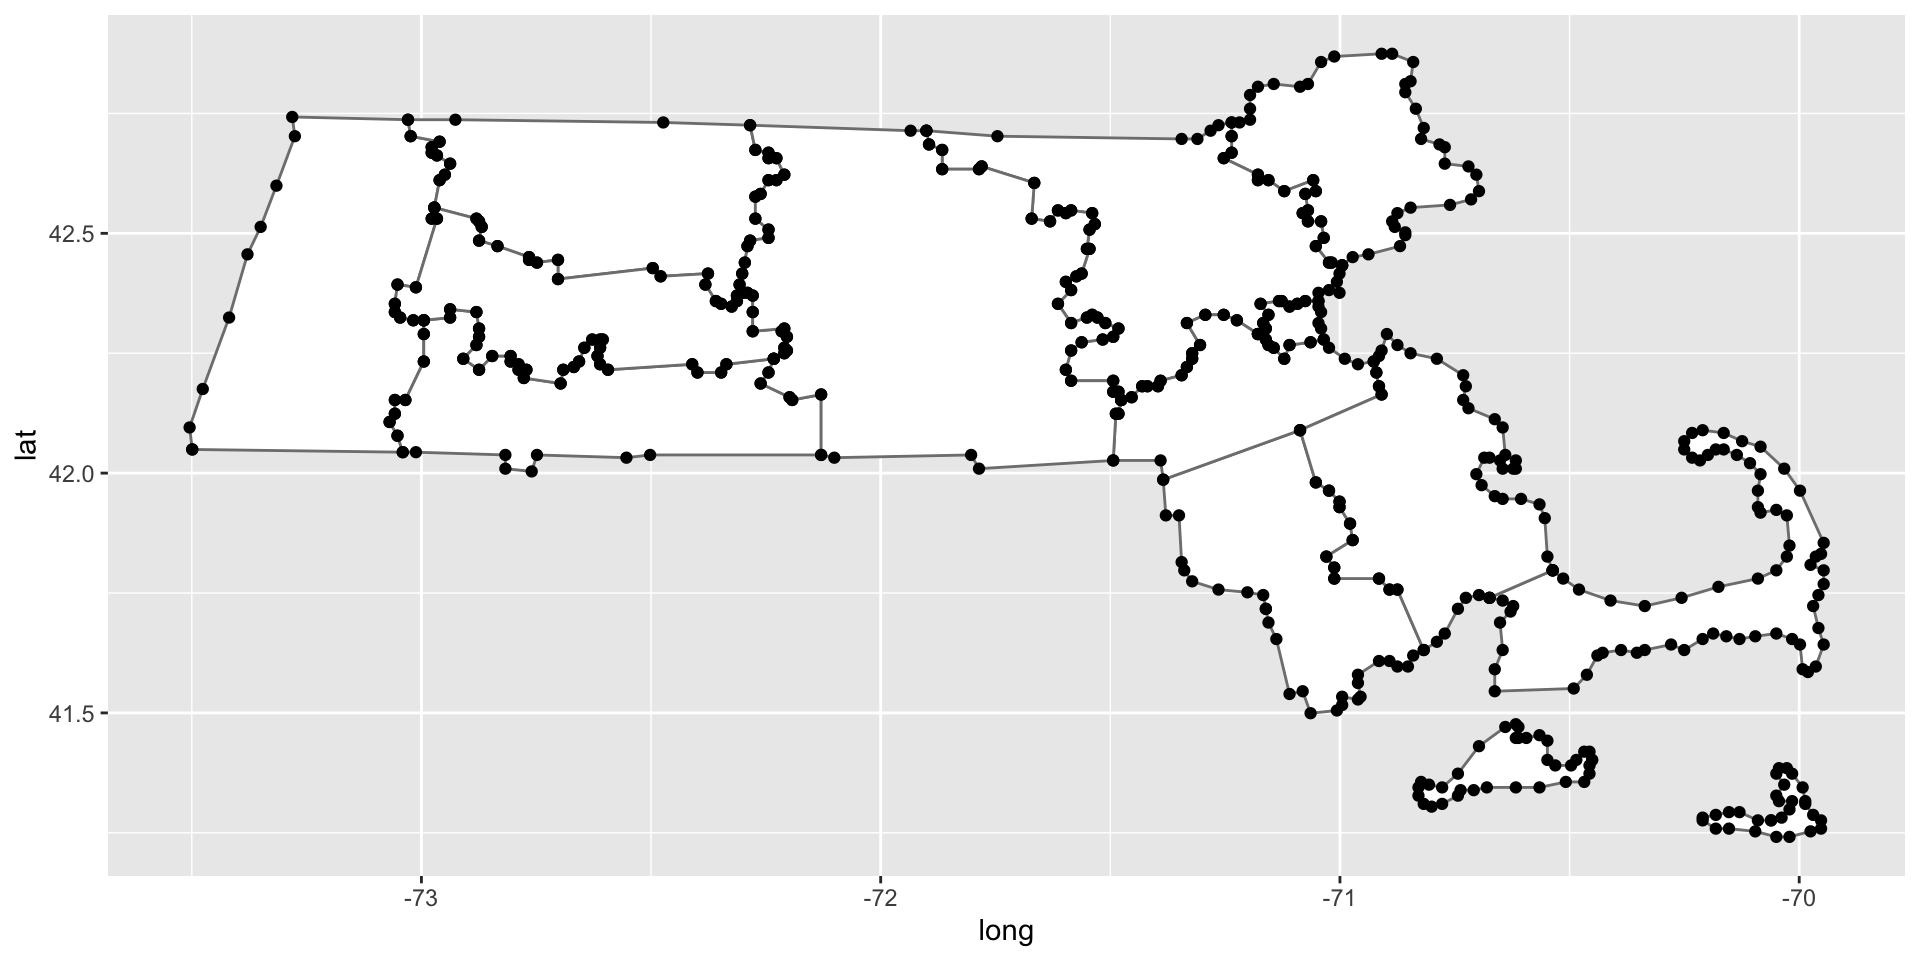
#coord_sf()Mapping projections
Coordinate Reference Systems (CRS) - Is the type of map projection employed To get a 3D Earth to a 2D surface.
Which one will coord_sf default to?
?coord_sfWest wing explanation
Adding the 4326 crs
ma_counties |> ggplot(aes(long,lat,group=group))+
  geom_polygon(fill = "white", colour = "grey50")+
  geom_point()+
  coord_sf()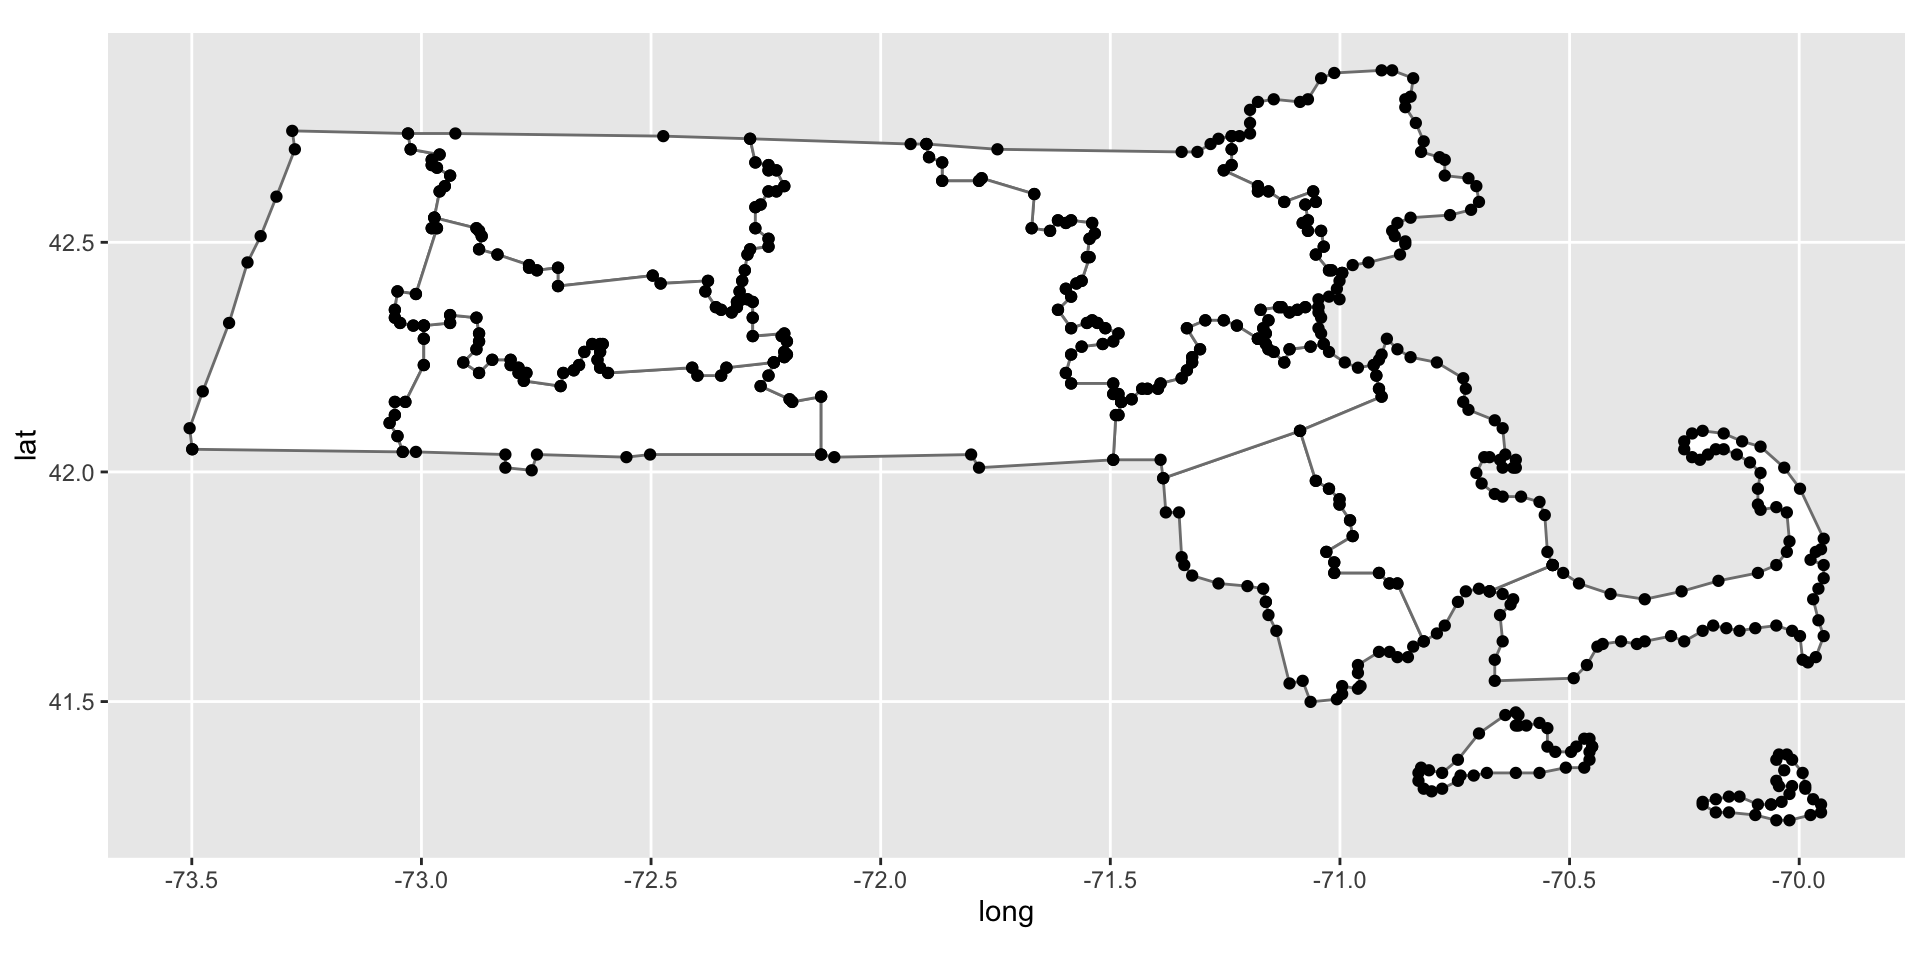
Add some cities
Let’s grab just Massachusetts cities from the data frame us.cities.
# us.cities comes from the maps package

ma_cities <- us.cities |>
  filter(country.etc =="MA") |>
  select(name, long, lat)

head(ma_cities)
name long lat
1 Andover MA -71.14 42.65
2 Arlington MA -71.16 42.42
3 Attleboro MA -71.30 41.93
4 Barnstable Town MA -70.30 41.70
5 Beverly MA -70.84 42.56
6 Billerica MA -71.26 42.56Exercise:
Plot MA cities onto our county map. Then clean up our map.
ma_counties |> ggplot(aes(long,lat))+
  geom_polygon(fill = "white", colour = "grey50",aes(group=group)) +
  #geom_point(data=ma_cities,.......)

  #This is the default mapping. Think GPS
 coord_sf(default_crs= st_crs(4326) )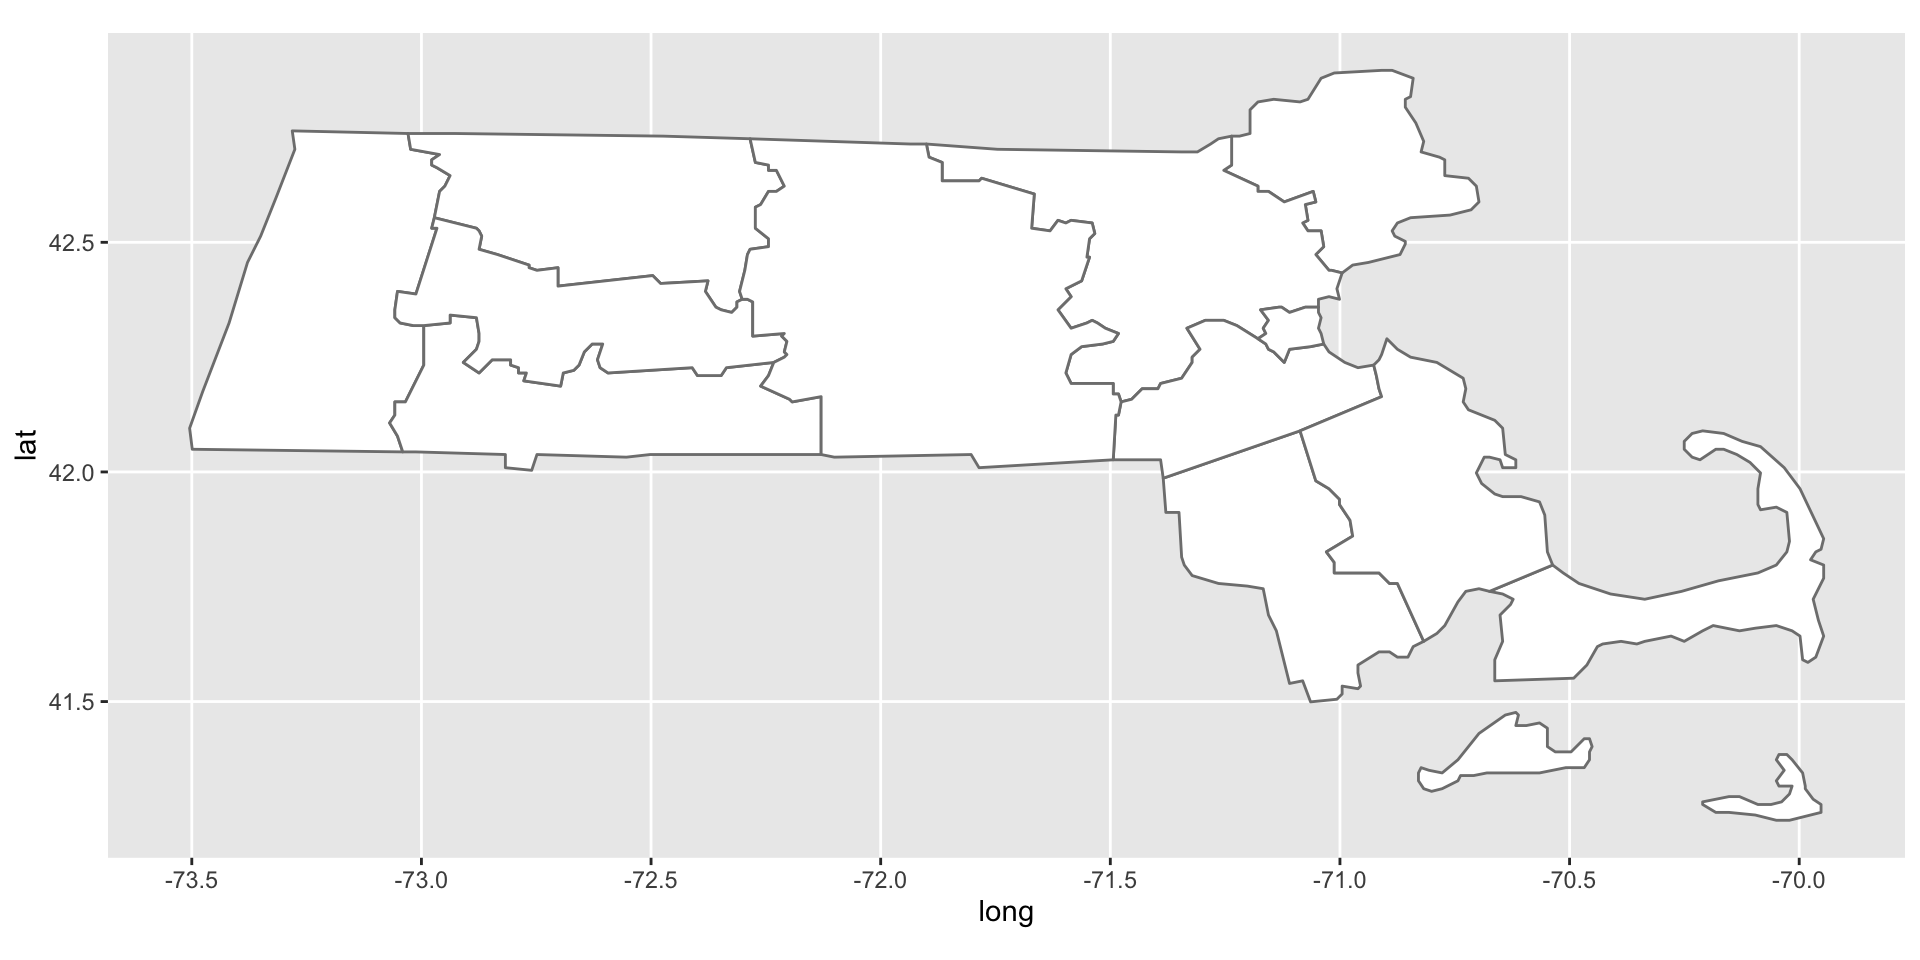
          # This is Mercator
          # st_crs(3857))
Shape files
Often times map data is saved as a shape file.
The US government has shape files here.