Data Viz no computers
Sheets data
Data Frame
Observations
Tidy Data
Variables
Variable Types
Part 1: Hand drawn graphs of survey questions.
Draw a graph of a variable. Do not write your name.
Talk to someone close to you.
Answer these questions:
Is the graph’s message or story clear?
What is missing from each graph?
What is distracting from the graph?
What does the graph do well?
What makes a clear graph?
Class discussion.
Graph Context.
Title
Well labeled Axes
Author’s Name
Data Source
Captions
Baumer’s Thoughts
Some of the following slides were borrowed by the text’s author.
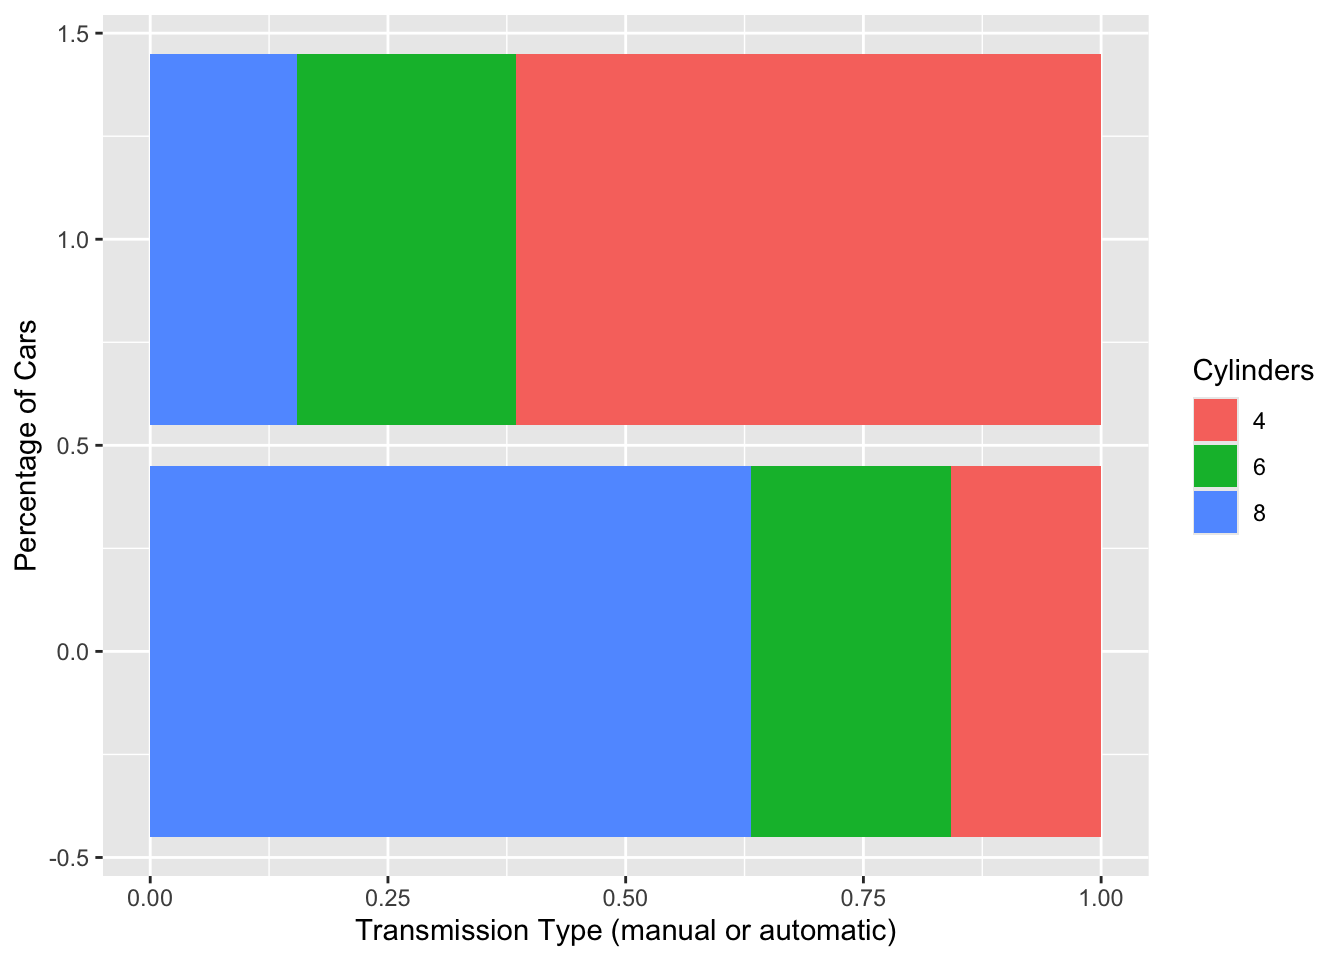
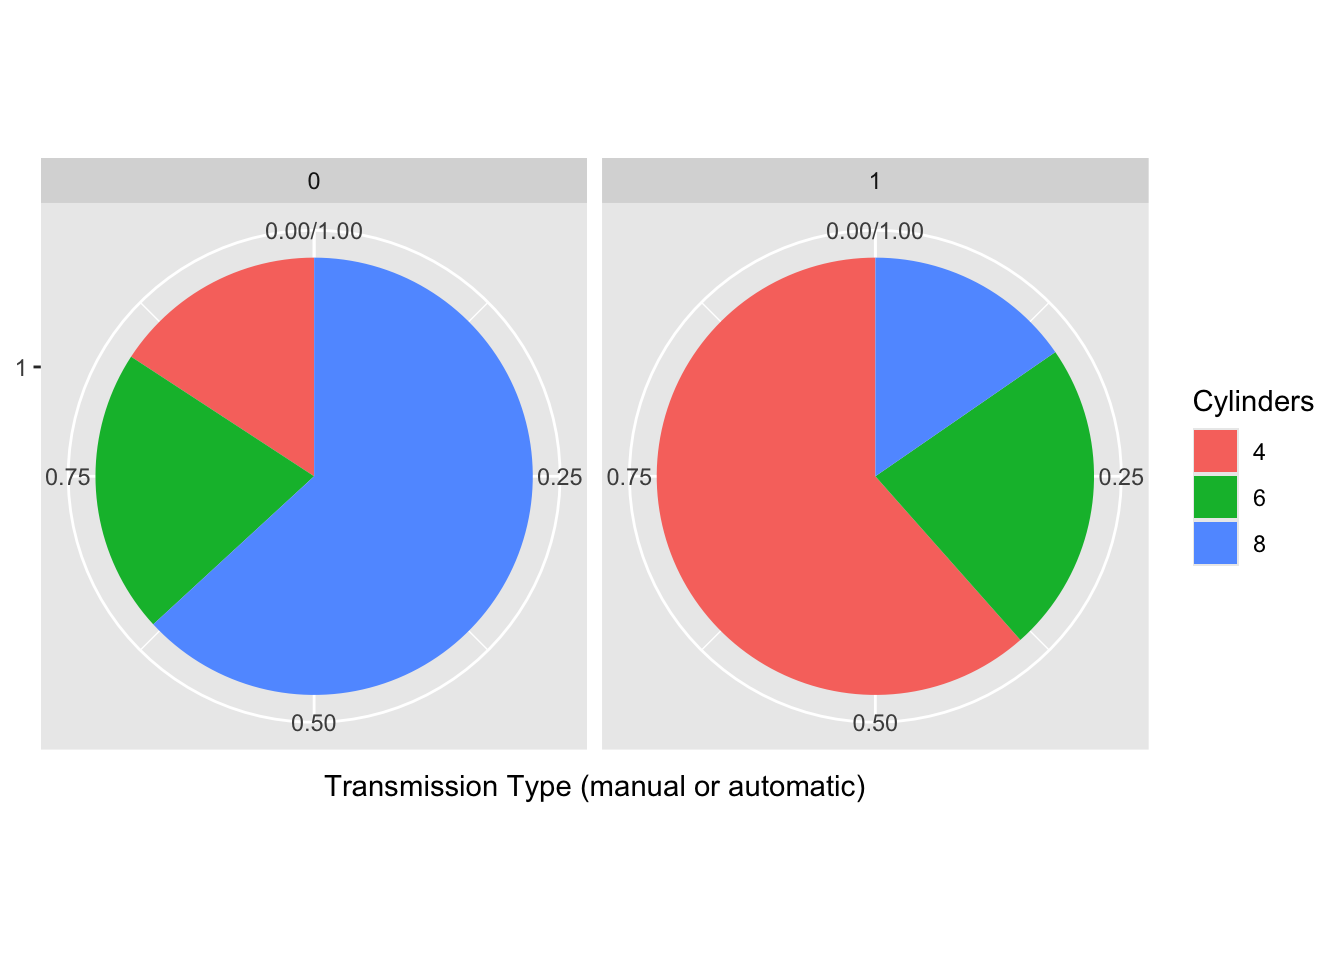
Pie charts
Are 6-cylinder engines more common among manuals or automatics?
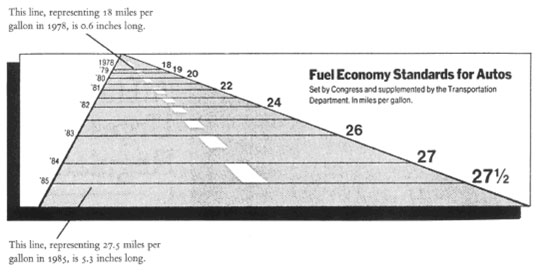
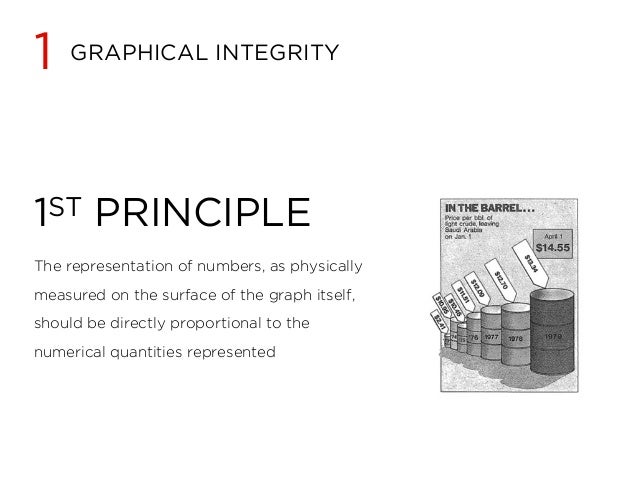
Unclear Scales
![]()
- Often not very clearly defined
- Easy to lie by manipulating scales
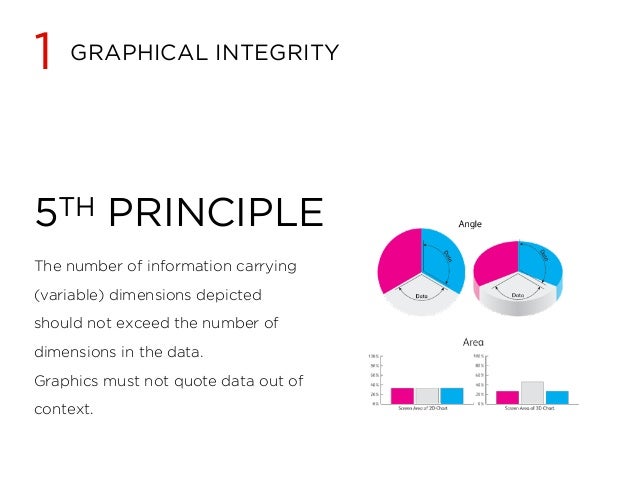
- Why perspective?
- Width of lines?
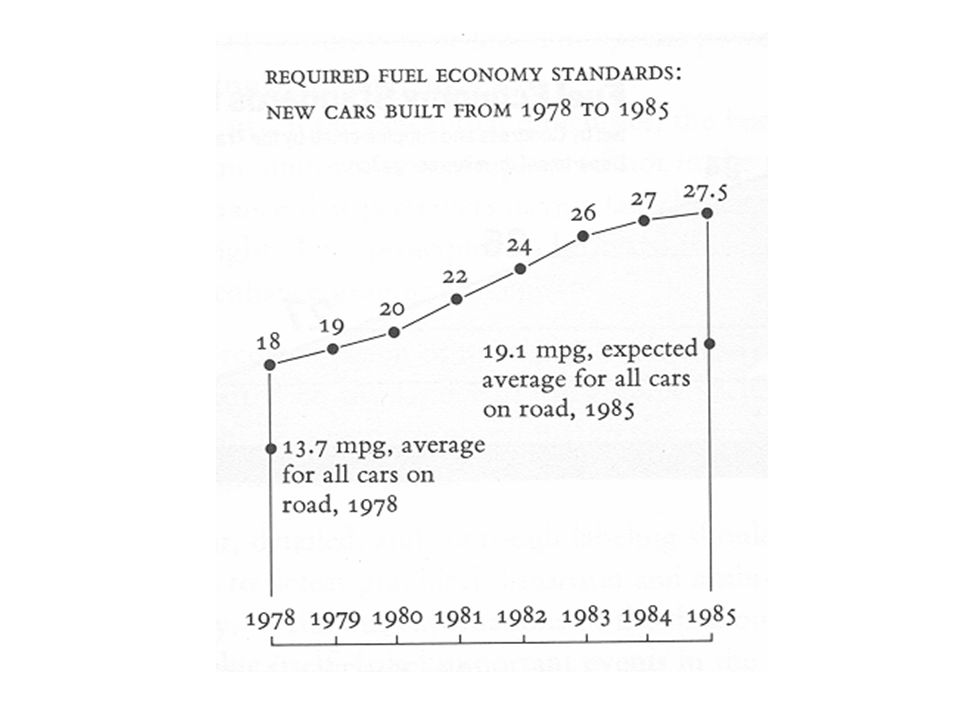
Clearer Scales
![]()
- Good graphics have clear scales
- Remember iPhone sales graphic
Balance of art vs. science
We’re only interested in the former