# A tibble: 50 × 18
   state emp_length  term homeownership annual_income verified_income
   <fct>      <dbl> <dbl> <fct>                 <dbl> <fct>
 1 NJ             3    60 rent                  59000 Not Verified
 2 CA            10    36 rent                  60000 Not Verified
 3 SC            NA    36 mortgage              75000 Verified
 4 CA             0    36 rent                  75000 Not Verified
 5 OH             4    60 mortgage             254000 Not Verified
 6 IN             6    36 mortgage              67000 Source Verified
 7 NY             2    36 rent                  28800 Source Verified
 8 MO            10    36 mortgage              80000 Not Verified
 9 FL             6    60 rent                  34000 Not Verified
10 FL             3    60 mortgage              80000 Source Verified
# ℹ 40 more rows
# ℹ 12 more variables: debt_to_income <dbl>, total_credit_limit <int>,
#   total_credit_utilized <int>, num_cc_carrying_balance <int>,
#   loan_purpose <fct>, loan_amount <int>, grade <fct>, interest_rate <dbl>,
#   public_record_bankrupt <int>, loan_status <fct>, has_second_income <lgl>,
# total_income <dbl>Statistical Thinking
Schwab
Read beforehand
The Data
Vocabulary
# A tibble: 2 × 18
  state emp_length  term homeownership annual_income verified_income
  <fct>      <dbl> <dbl> <fct>                 <dbl> <fct>
1 NJ             3    60 rent                  59000 Not Verified
2 CA            10    36 rent                  60000 Not Verified
# ℹ 12 more variables: debt_to_income <dbl>, total_credit_limit <int>,
#   total_credit_utilized <int>, num_cc_carrying_balance <int>,
#   loan_purpose <fct>, loan_amount <int>, grade <fct>, interest_rate <dbl>,
#   public_record_bankrupt <int>, loan_status <fct>, has_second_income <lgl>,
#   total_income <dbl>
Data Frame
Observations
Tidy Data
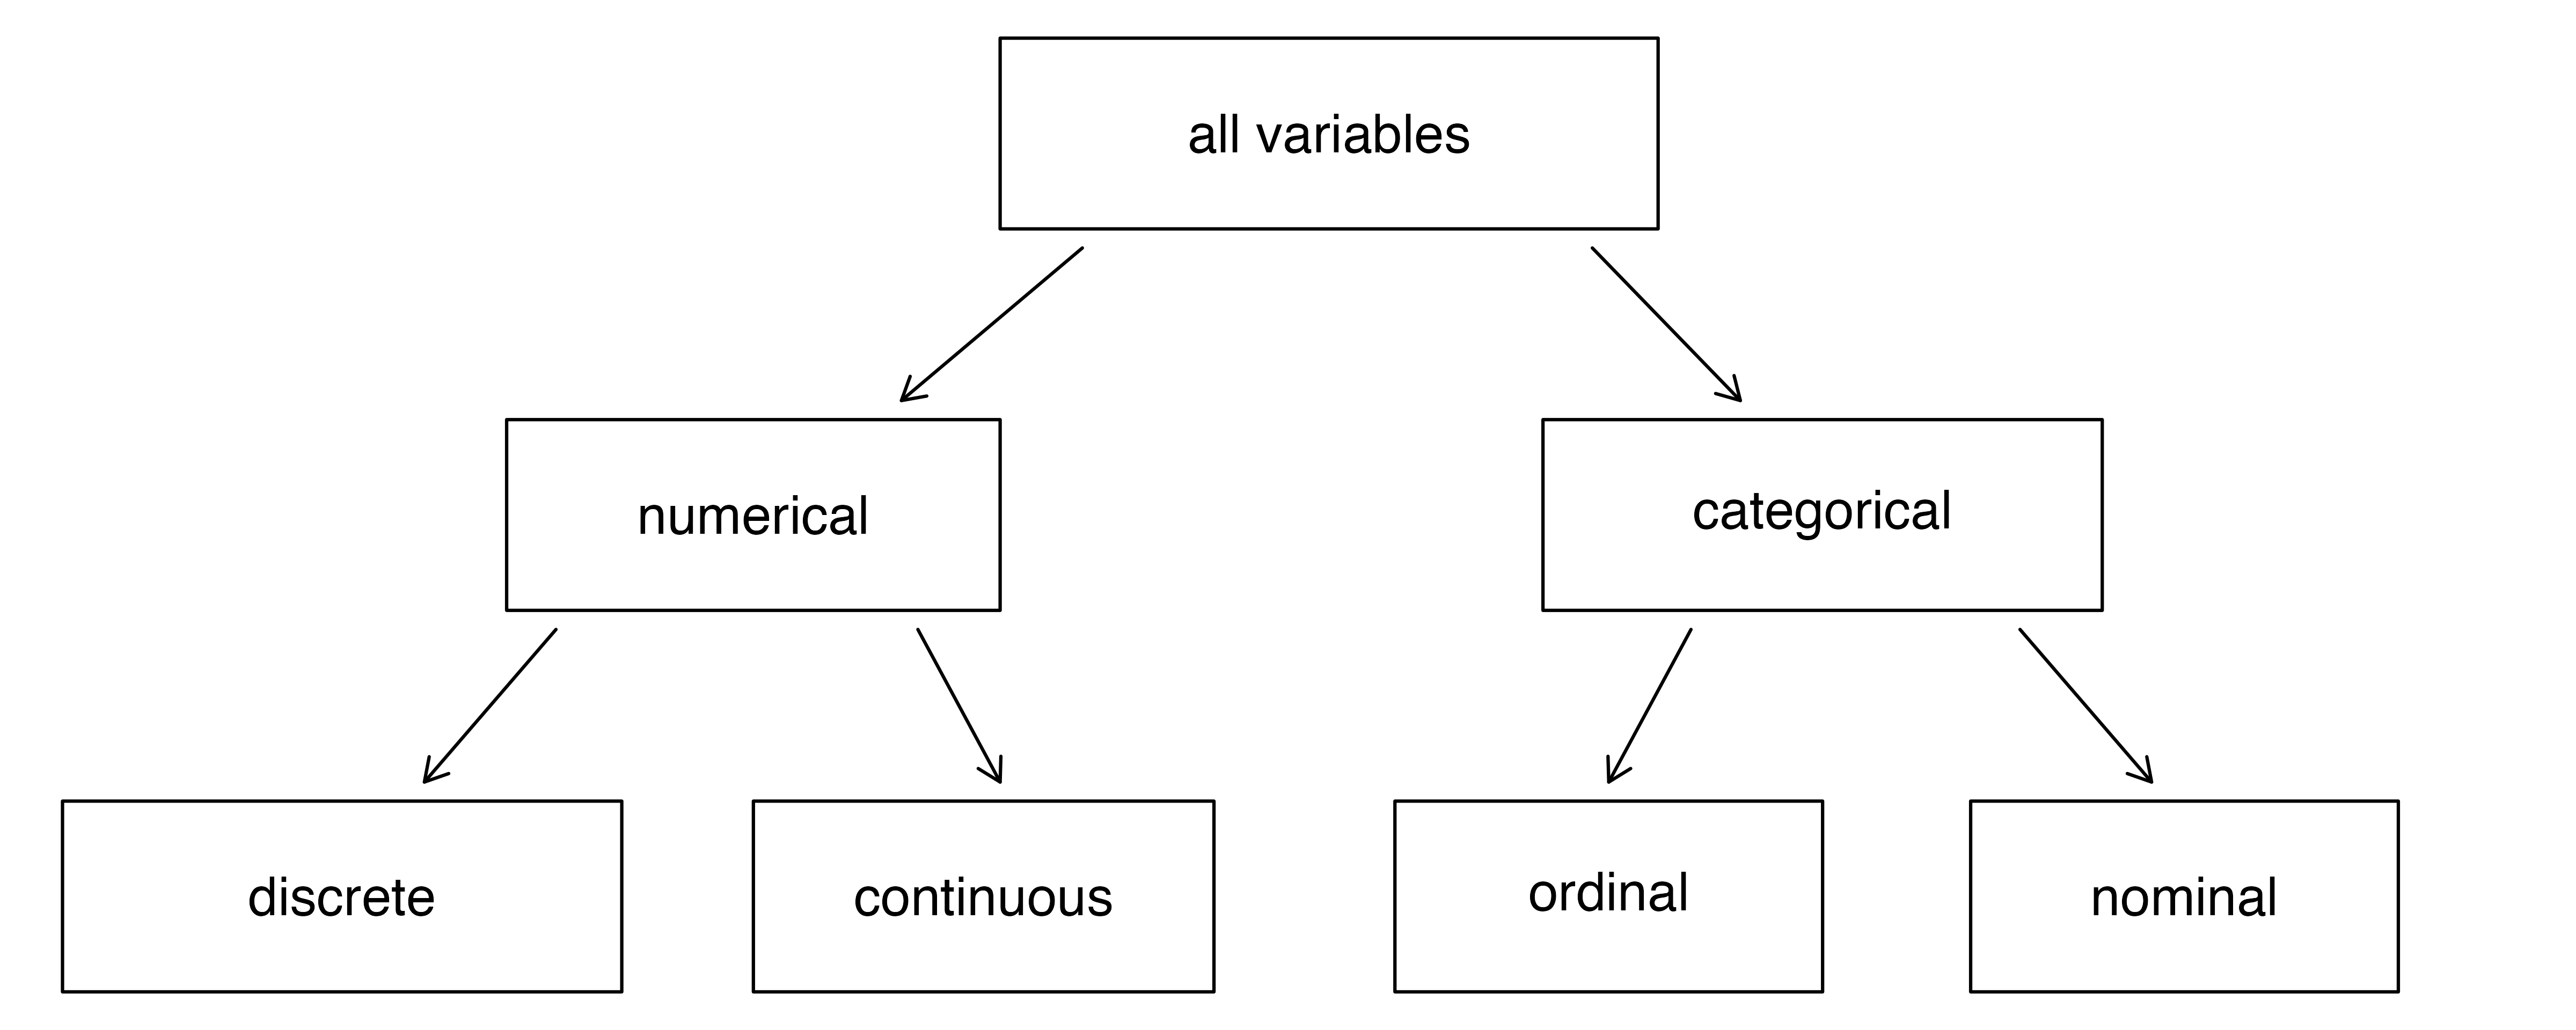
Variables
Variable Types
More on variable types:
A mean
[1] 86170Explanatory and Response
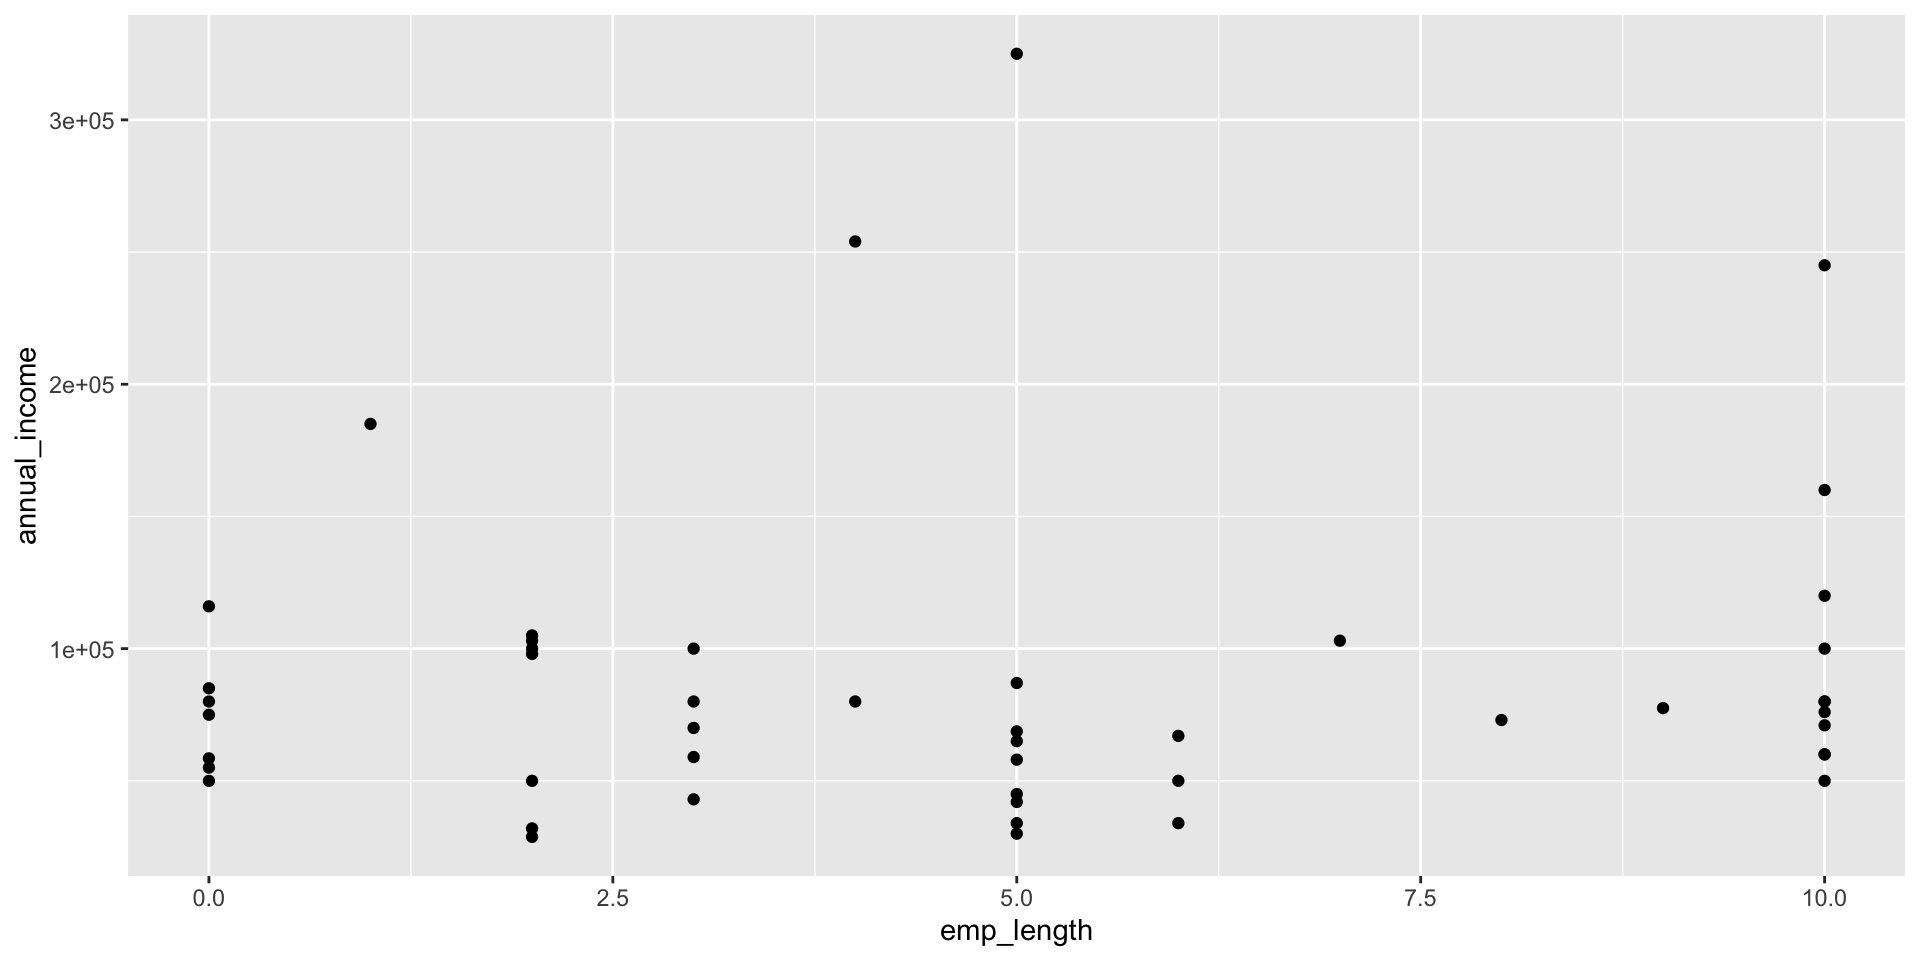
Consider the variables emp_length and annual_income.
Does the length of someone’s employment explain their income?
A scatter plot
Observational study or experiment.
Experiment - Has some control or non-treatment variable.
Observational - No control.
It is harder to say that x causes y without a control.
Examples
Problems 10 and 11 in chapter 1